


Databricks SQL is a powerful tool for querying and analysing data in Databricks Lakehouse. It empowers data analysts and engineers that are familiar with SQL, to extract insights without the need for complex code, thereby streamlining and speeding up the data analysis process. It is useful for collaborating between teams, can share queries, develop basic dashboards, and seamlessly integrates with BI tools such as Power BI, dbt, and Tableau.
The following are the key concepts of Databricks SQL.
SQL Warehouses
SQL Warehouses (formerly SQL endpoints) is the compute resources utilised by Databricks SQL.
Essentially this is the connection that is used to run your SQL queries, where you configure the cluster size/family, scaling and termination options.
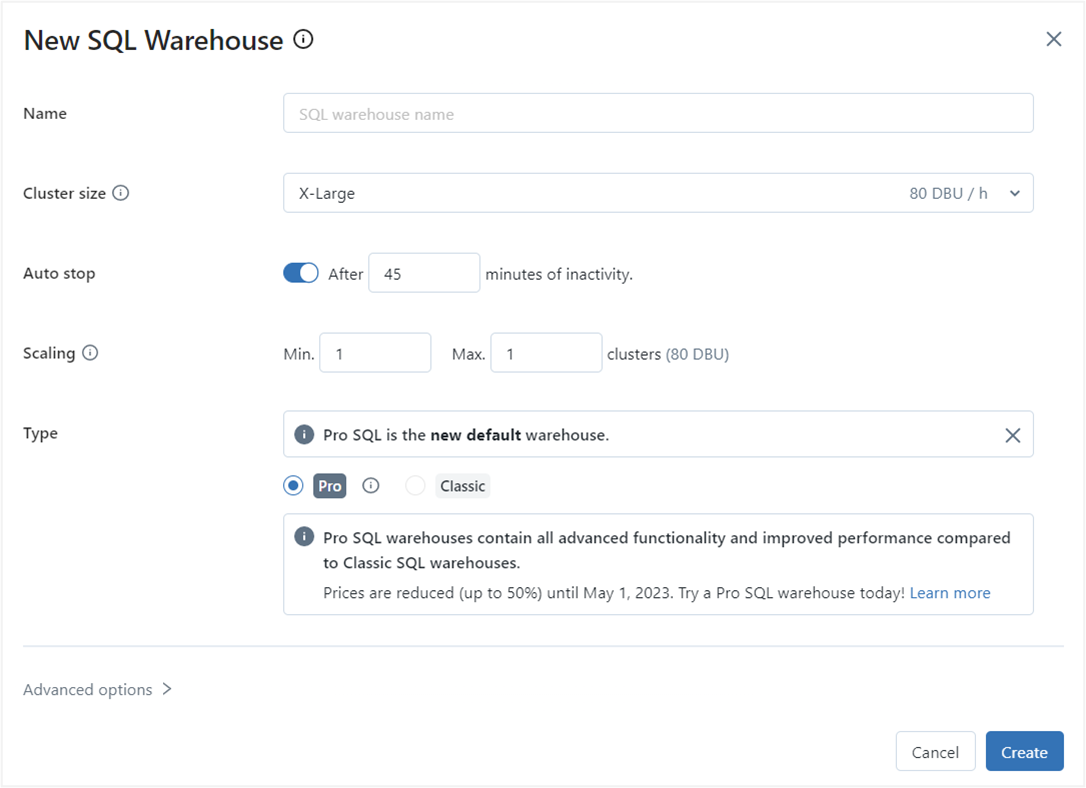
Warehouse Types
There are three distinct warehouse types available to users: Classic, Pro, and Serverless.
- The
Classicwarehouse type offers limited Databricks SQL functionality and basic performance features. - The
Prowarehouse type supports all Databricks SQL functionality and delivers higher performance features in comparison toClassic, including query federation, workflow integration, and data science and ML functions. - The
Serverlesswarehouse type delivers advanced performance features and supports all of the features available in theProtype, along with instant and fully managed compute.
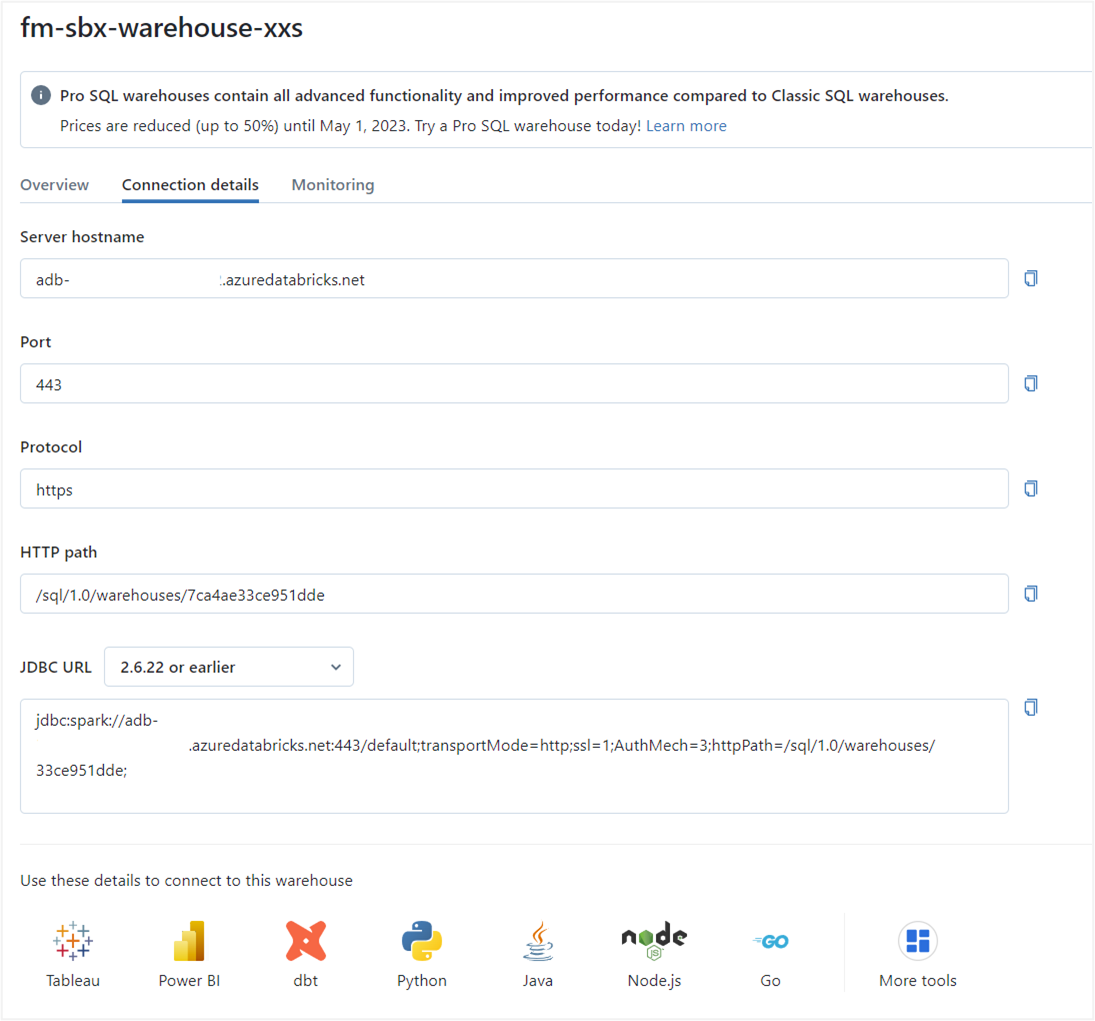
Once a warehouse is established, you can easily access and connect to the data using BI tools, such as Power BI, dbt, and Tableau by downloading the relevant connection files. This means you don’t have to manually configure your BI tools to connect to the SQL Warehouse, though you still can if you prefer.
SQL Editor
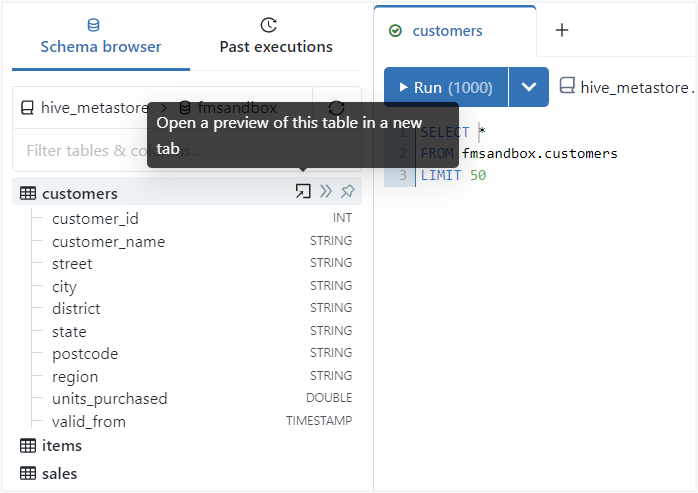
SQL Editor allows you to execute SQL queries and interact with the databases in your Databricks workspace. When a database is selected, you can easily view all the objects it contains, including tables and fields, along with their data types.
One of the most convenient features of the SQL Editor is the ability to preview the data in your tables. By hovering over a table, you can retrieve up to 50 records using the arrow icon, which provides a quick and efficient way to preview the data.
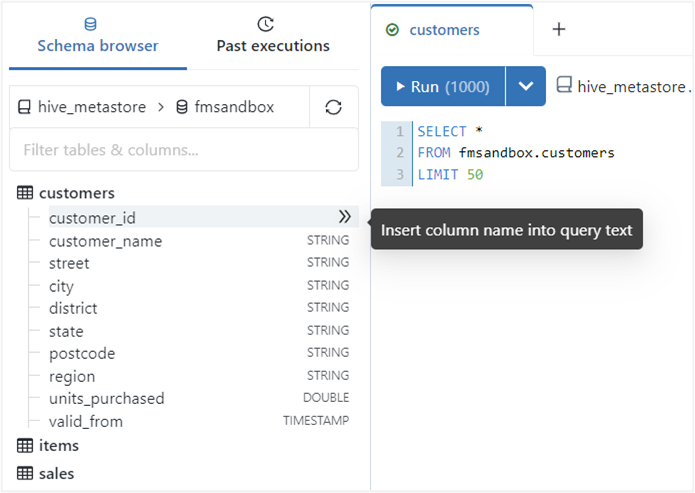
In addition to the preview feature, you can quickly insert table or field names into your query script using the two arrows icon when hovering over the tables and fields.
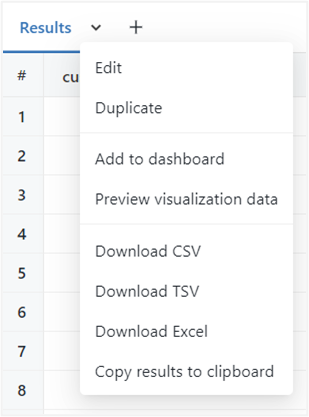
All executed queries can be easily downloaded for further analysis in CSV, Excel, and TSV formats or added to a Dashboard for further data exploration.
Query Filters and Parameters
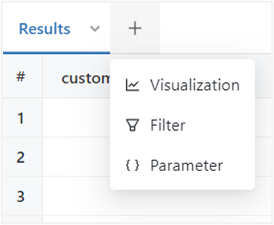
SQL Editor supports the ability to add Filters and Parameters to your scripts, using the dropdown option (Plus icon).
Filtersallow you to reduce the dataset after the query has been executedParametersenable you to limit the data returned by supplying an input value into a query before it is executed.
Query Filter
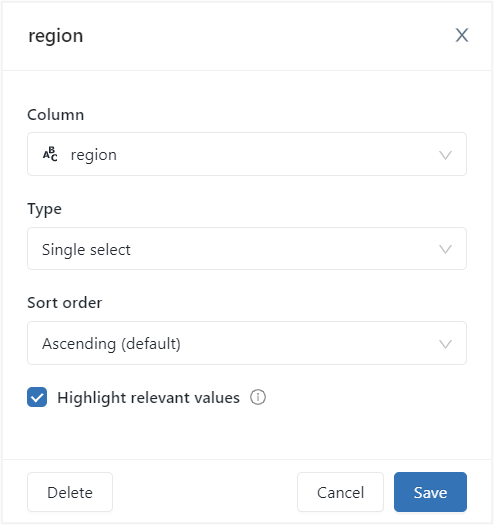
Filters are added once the query has been executed using the dropdown option (Plus icon). The popup options allow you to specify the column, type, and sort order of the filter.
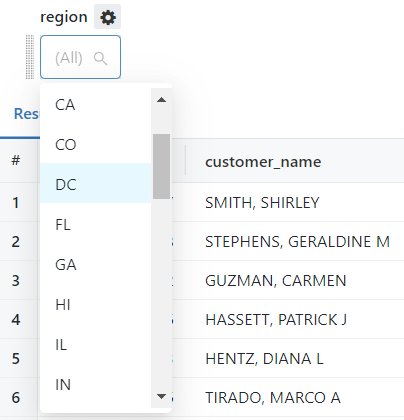
Once the filter is defined, a widget will appear above the results panel, where the filter value can be selected.
Query Parameters
Parameters can be added directly to the SQL query using curly braces (). A widget will appear above the results panel where the parameter value can be entered.
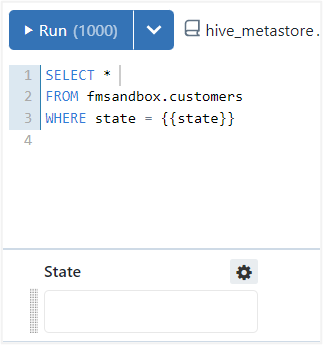
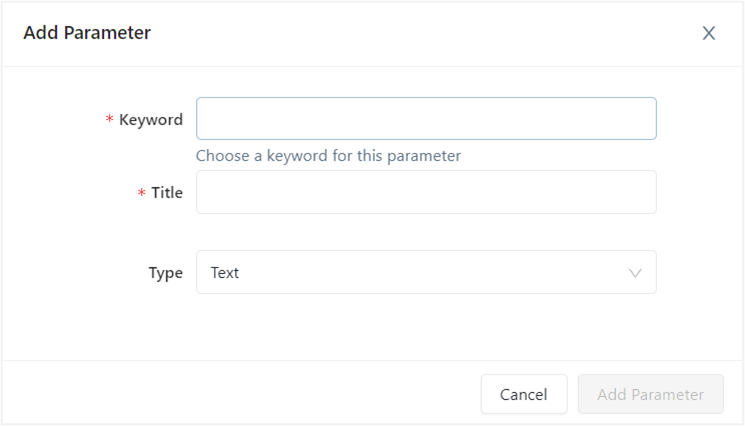
The parameter settings can be altered using the “Add Parameter” option (gear icon), this allows for the parameter Keyword, Title, and Type to be defined.
Keyword: this corresponds to the parameter in the query.Title: will appear over the widget.Type: supports Text (default), Number, Dropdown List, Query Based Dropdown List, Date, Date and Time, Date and Time (with seconds), and Date Range.
Queries
Query Caching
Databricks SQL offers an efficient method of storing query results through Query Caching. This means that all executed queries and their results are retained, allowing users to quickly access previously executed results when they reopen the query in the SQL Editor.
The caching mechanism applies to both queries run through the SQL Editor UI and those executed through the SQL Warehouses. The results are cached per user when ran through SQL Editor UI and per cluster when executed through SQL Warehouses.
The caches are saved in the Databricks file system and are dynamically updated every time a query is executed, this ensures users have access to the most recent results.
Query caching streamlines the query process and enhances the overall user experience by providing quick and easy access to previously executed results.
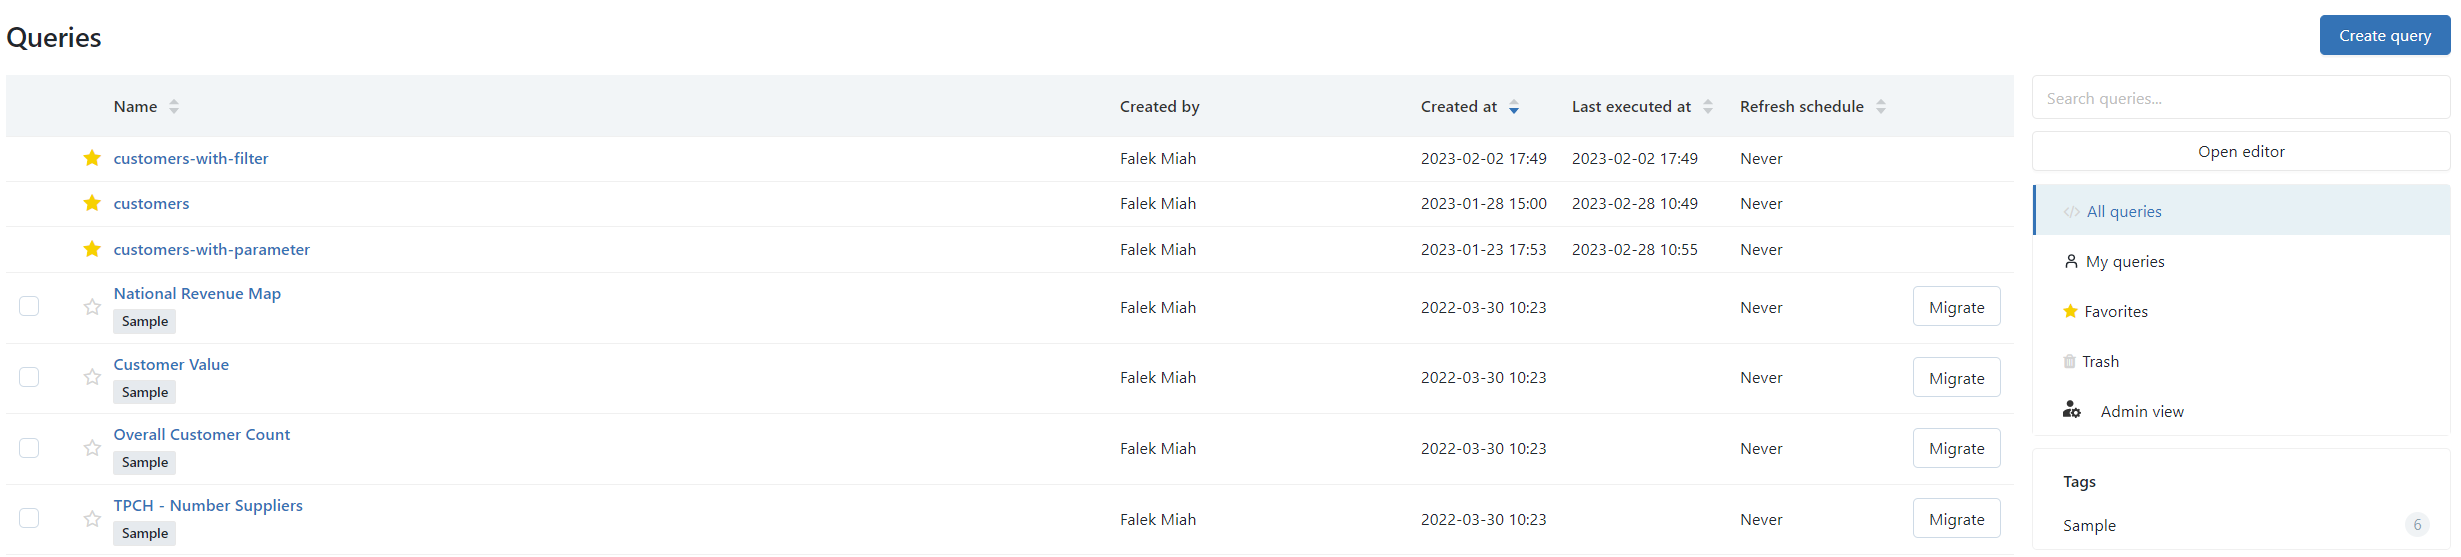
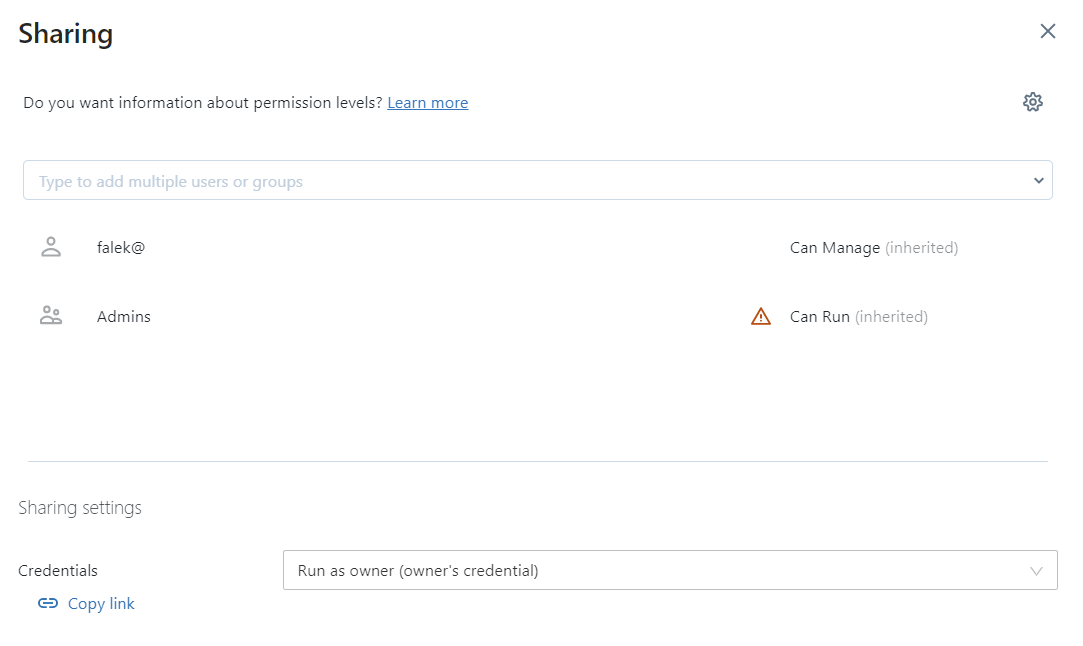
Query Sharing
Queries executed can be efficiently managed and shared among team members. With the option to save full or partial queries, which can be labelled and organised for easy retrieval.
Query Snippets are reusable segments of code, that can be created and utilised through an auto-complete feature. These snippets can significantly enhance productivity, particularly for complex case and join statements.
Dashboards
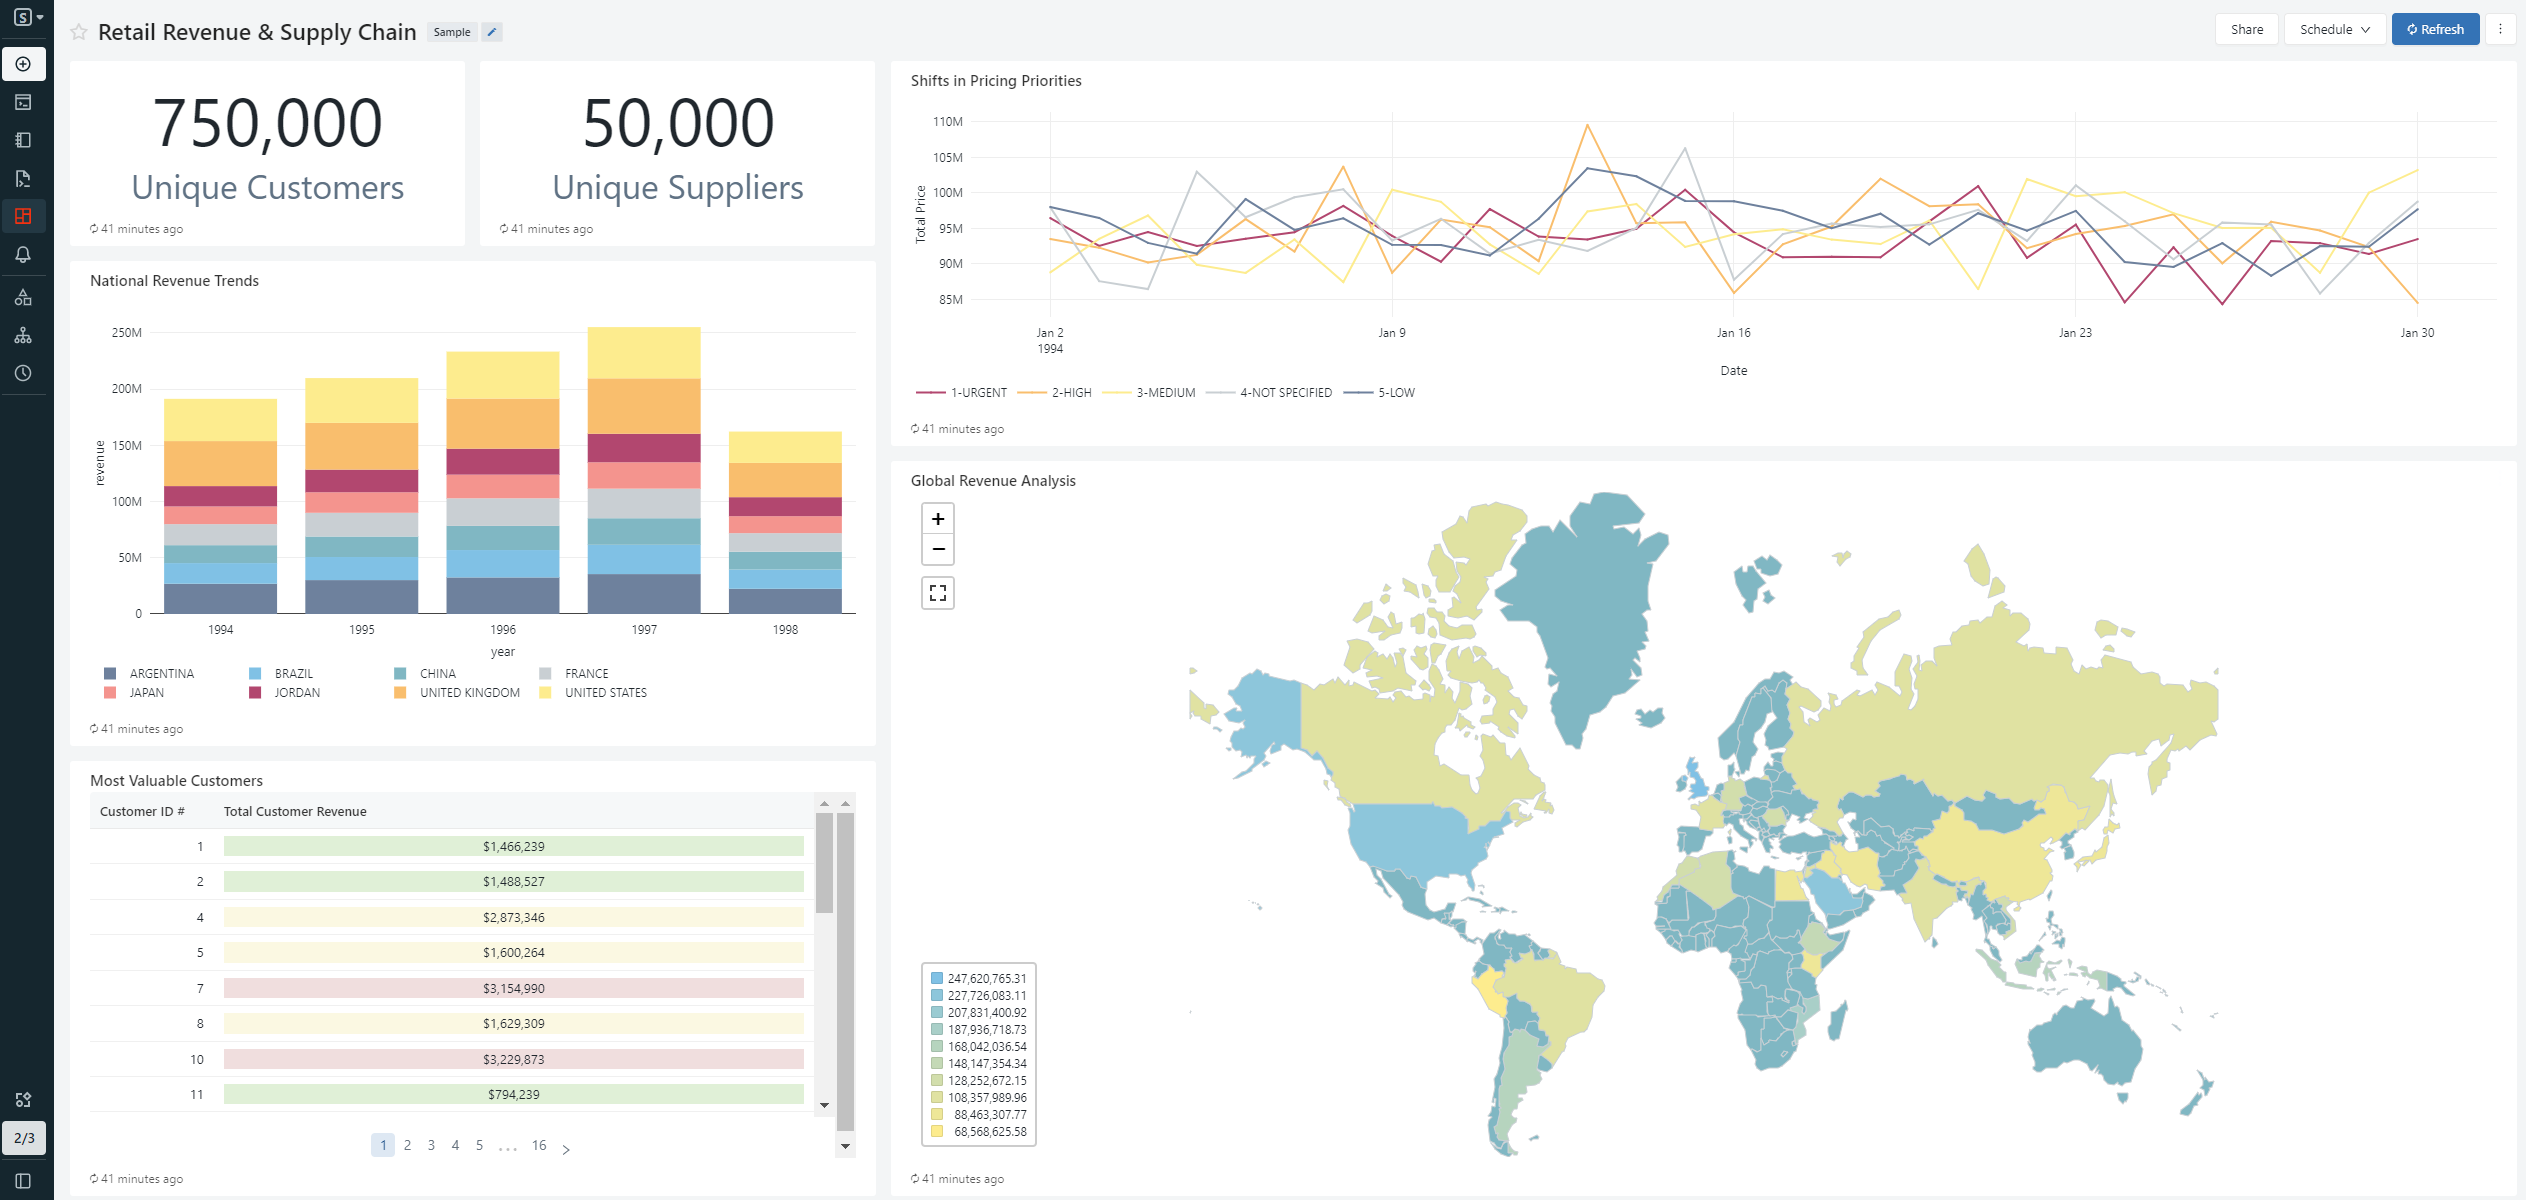
Dashboards are a good way to see all the key information at a glance within your Databricks Lakehouse. It combines all the visuals to provide a comprehensive view of the data in a single place. The visuals are based on SQL queries and can be displayed in a variety of ways, including pivot tables, charts, heat maps, and more.
The dashboards can be parameter-driven, meaning the data can be limited based on specific parameters, saving on compute, and running costs. They can be updated either manually or automatically using schedules and have the option of a subscription service to ensure users have access to the latest information.
These dashboards are basic compared to other BI tools (Power BI, dbt, and Tableau), but they can be useful to understand the context and performance of the Lakehouse rather than for business analytics.
Alerts
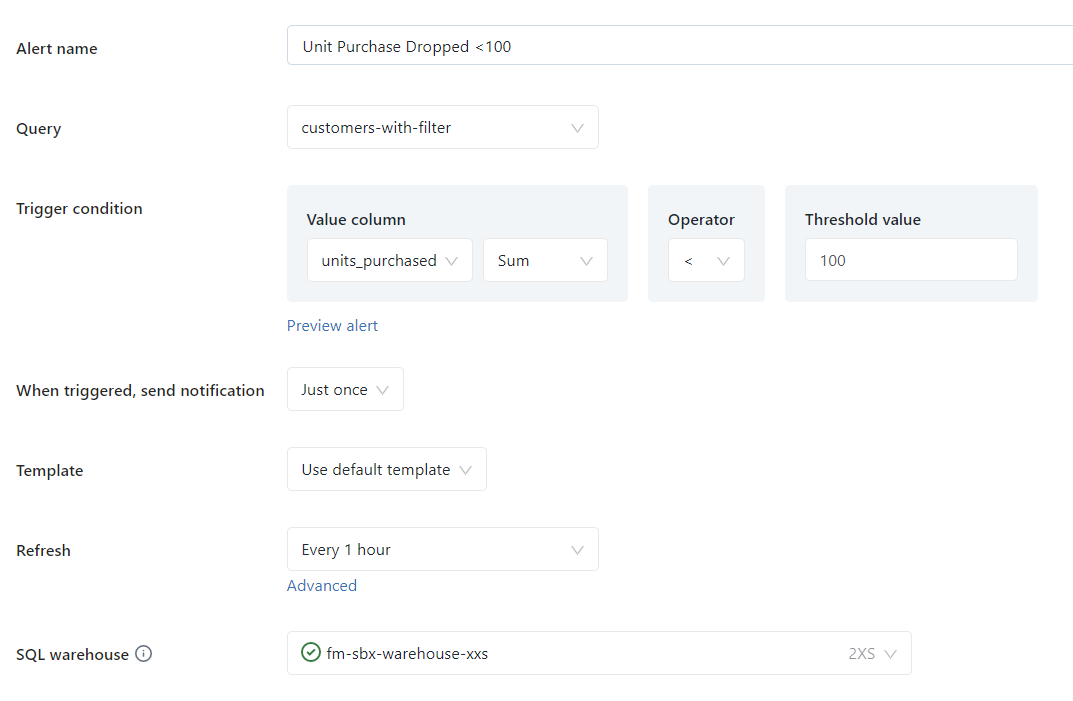
Alerts sends notifications based on a defined query when a field meets a specified threshold. This is useful when you want to monitor key metrics and react quickly to data changes.
The frequency of notifications can be easily configured, and the refresh schedule can be tailored to ensure regular updates are sent. These refresh schedules are separate to the query’s refresh schedules.
In addition, the notification message can be customised to provide relevant and standardised information to the recipient, or a default template can be used.
Data
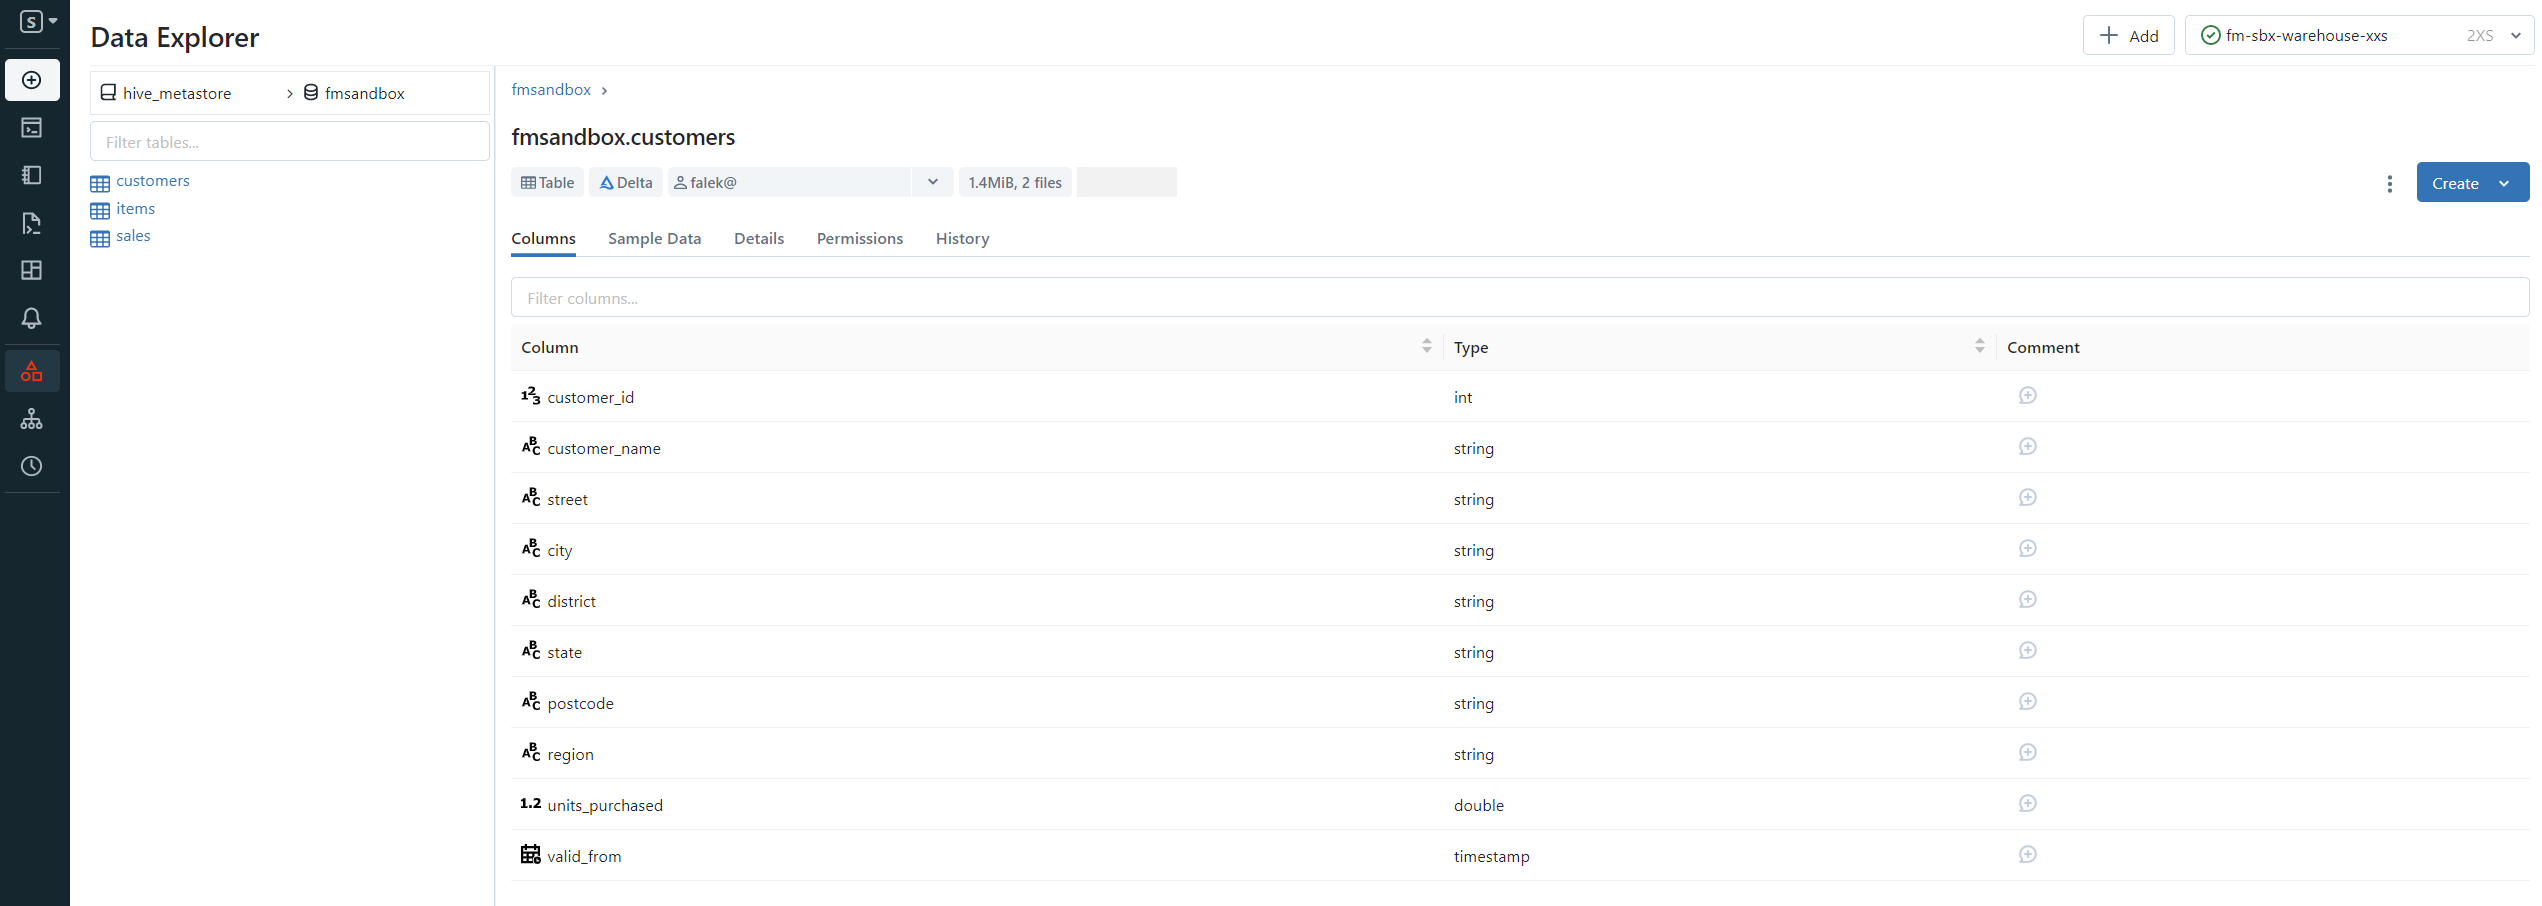
Data Explorer allows you to efficiently explore, manage, and control the tables within the Databricks workspace. Where you can view the table schemas, details, properties, and sample the data, as well as manage and change permissions if you are the administrator.
Query History
Query History is a good resource for optimizing query performance. It offers an overview of all the SQL queries executed on the SQL Warehouses, which can be filtered by user, duration, and time range. This provides an easy and efficient way to locate specific queries and review performance.
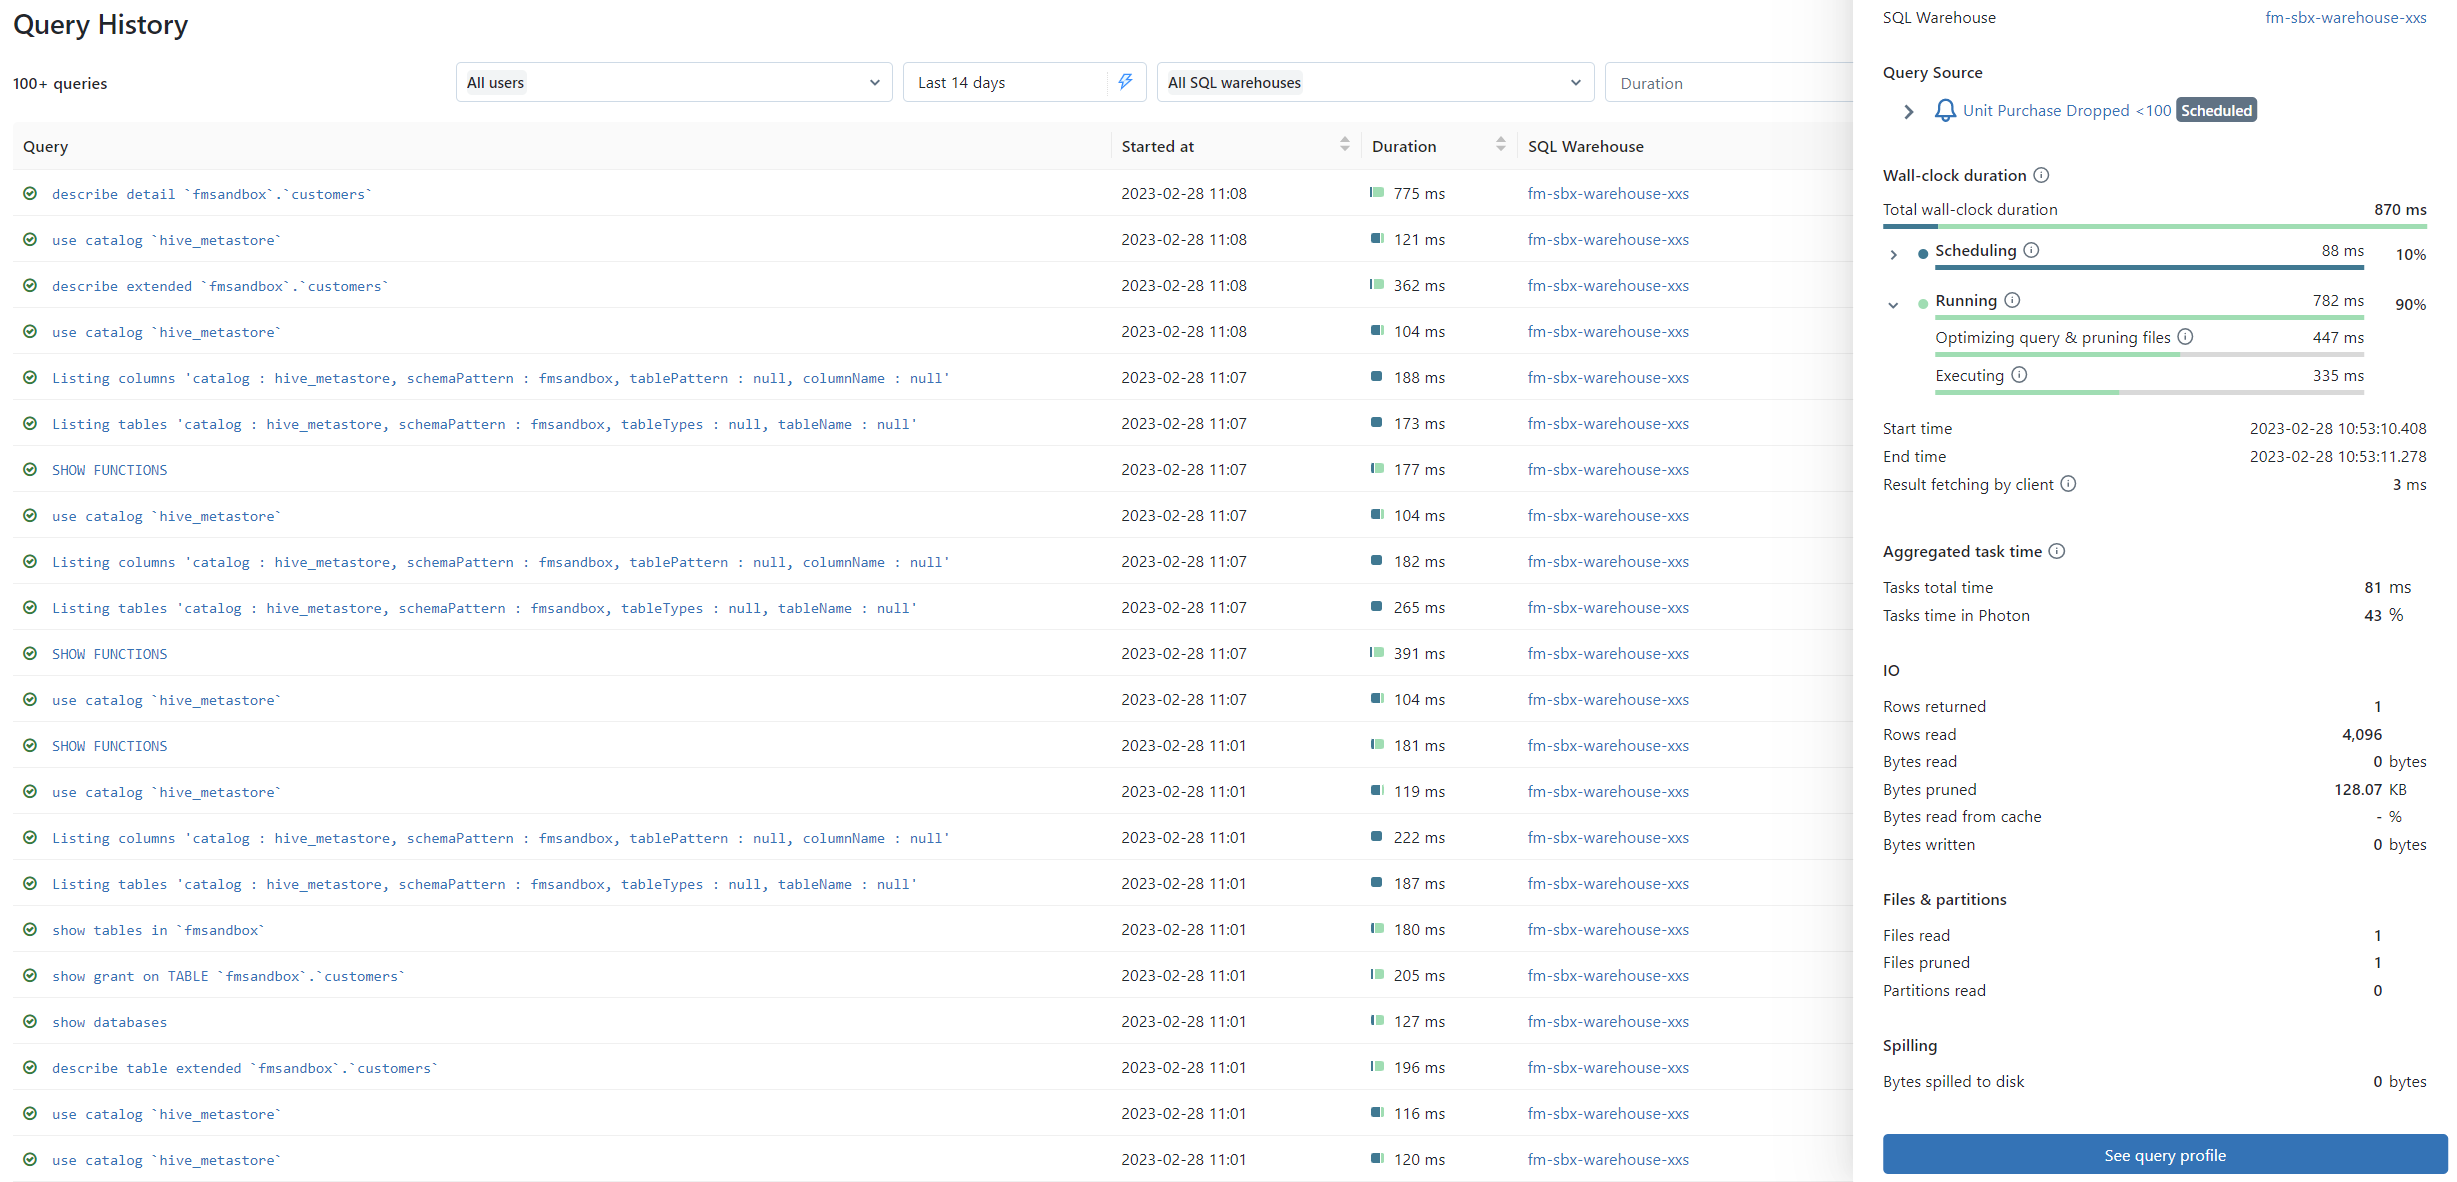
Query Profile
Query Profile provides a detailed view of each query execution, offering useful insights into the query performance. This allows you to analyse and understand the workflow of the queries, in a visual way, either through the Directed Acyclic Graph (DAG) or Tree views. It displays the key metrics and consumption for each task involved in the query, including the number of rows processed and the time spent.
The content of the profile can be shared or exported as a JSON file, making it easy to share with others or to maintain a record for future reference.
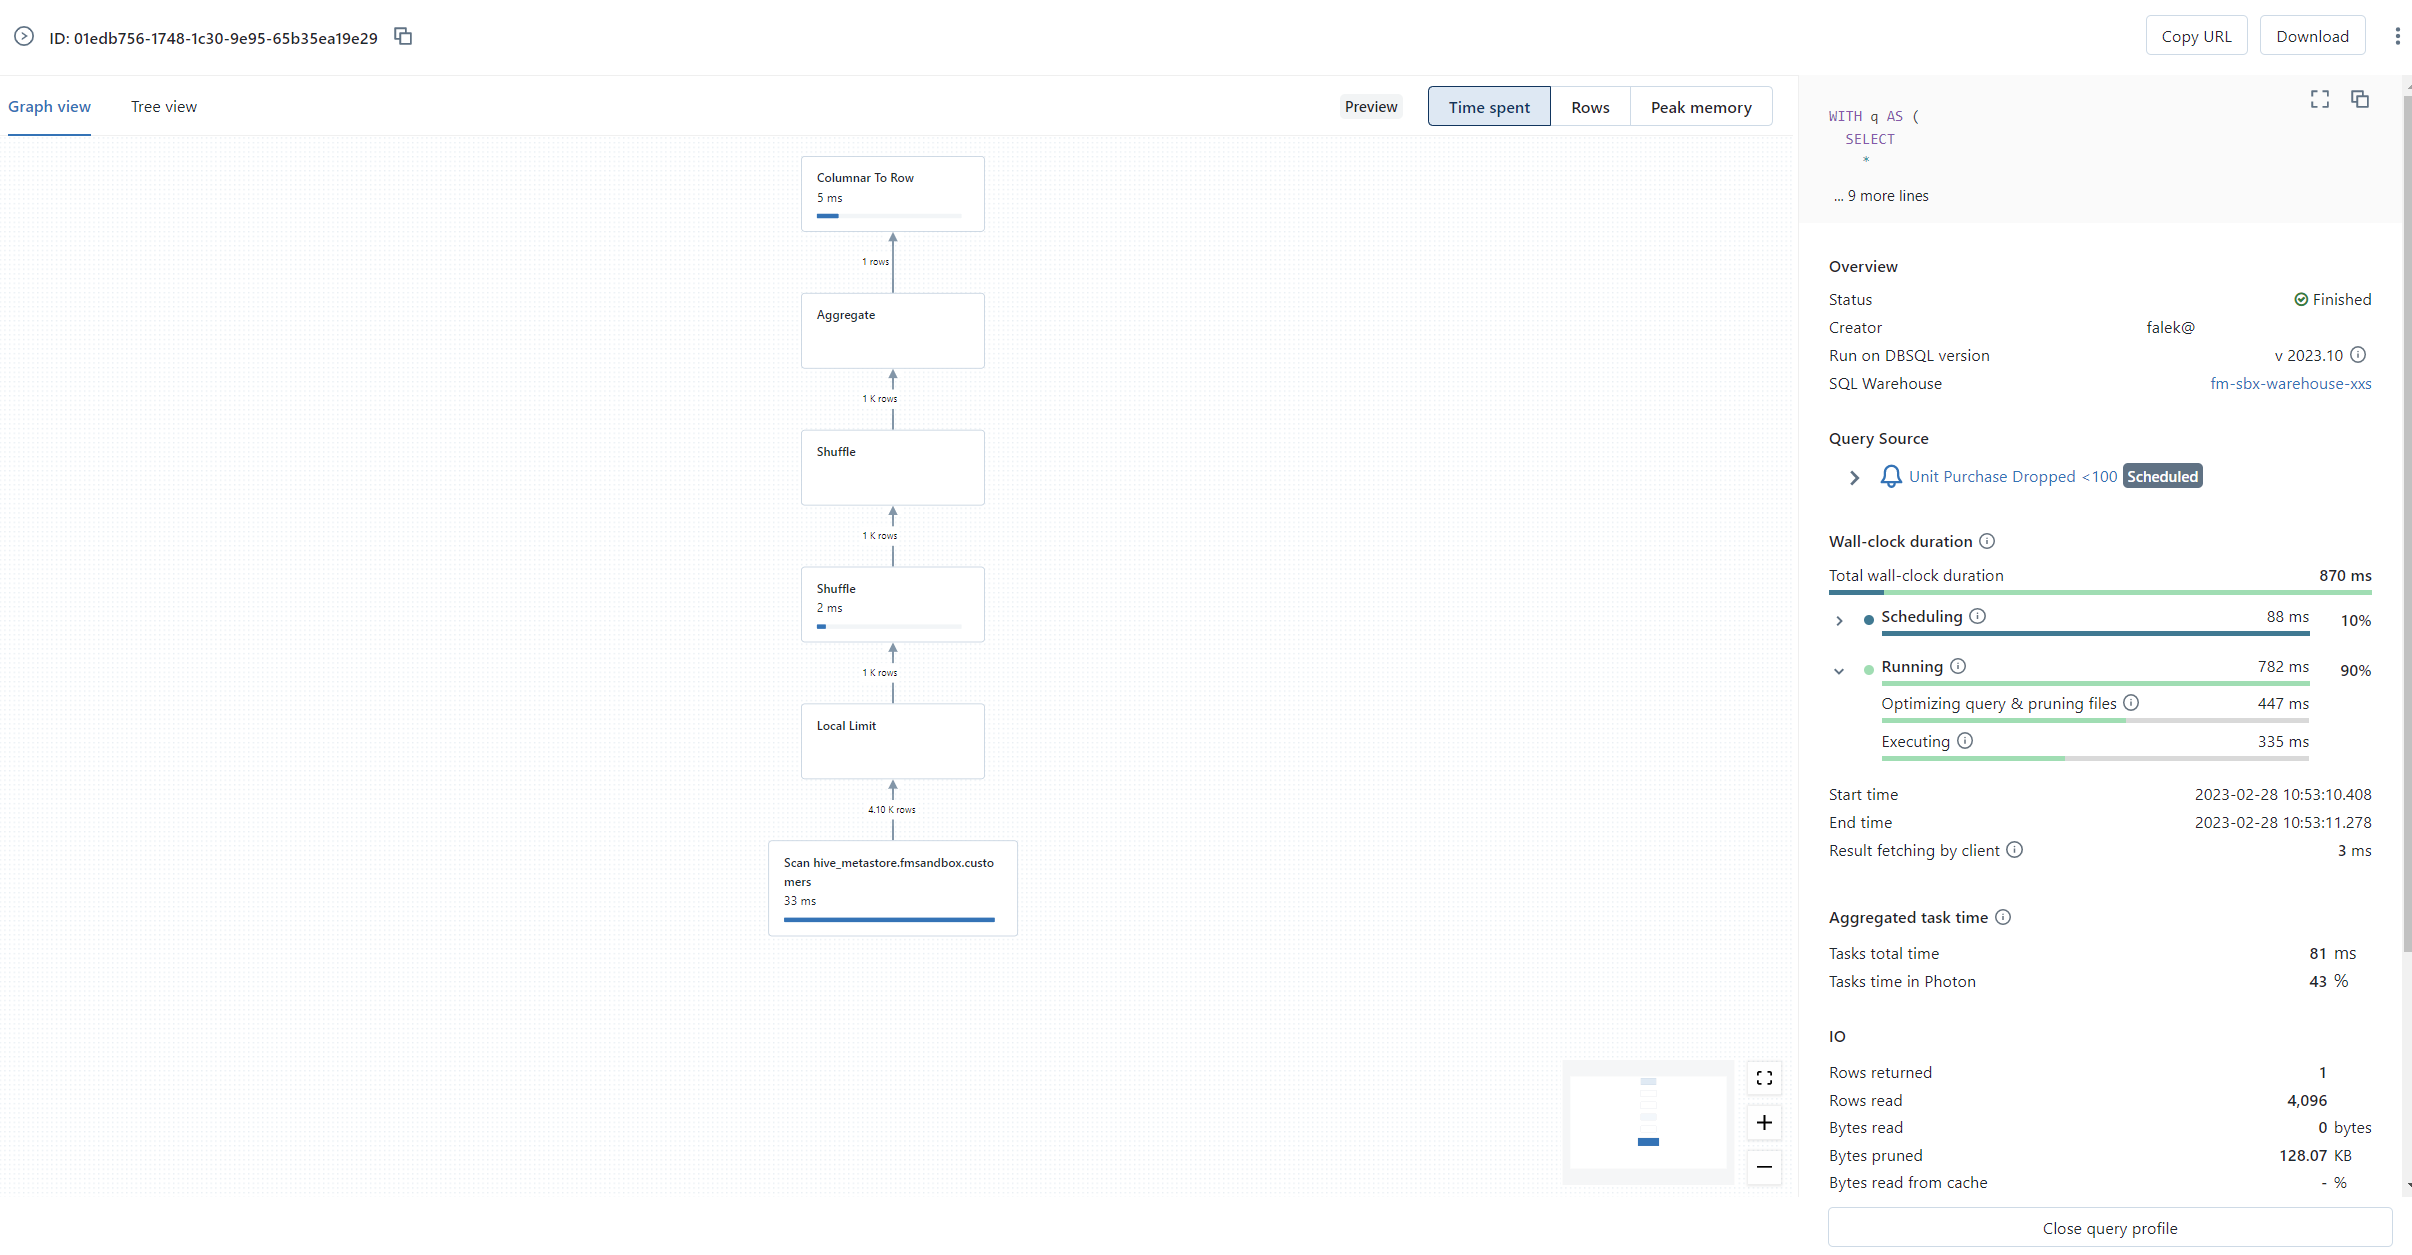
The Query History and Query Profile features are incredibly helpful when it comes to debugging issues, troubleshooting query performance, and optimizing the efficiency of the SQL Warehouses. They provide a wealth of information and make it easier to keep the SQL Warehouses running smoothly and efficiently.
Summary
Overall, Databricks SQL is a great feature within Databricks, that offers a simple and efficient way to work with data in the Lakehouse. It enables data analysts, engineers, and other professionals to interact with the Lakehouse by using their knowledge of standard SQL syntax and commands. It easily integrates with BI tools like Power BI, dbt, and Tableau, using the SQL Warehouse endpoint, allowing you to connect directly to the Lakehouse data.
The intuitive interface is easy to use and convenient for those familiar with querying SQL databases. The query performance and monitoring tools, provide valuable insights into the performance of the queries, enabling efficient ways to troubleshoot issues and identify improvements.
Finally, with the ability to share queries and collaborate with other members makes it a good solution for teams looking to work together on data-driven decisions and insights.