Introduction
NetworkX is a Python package for the creation, manipulation, and study of the structure, dynamics, and functions of complex graphs. It’s a really cool package that contains heaps of graph algorithms for all different uses. In this tutorial, I will cover how to create a graph from an edge list and different ways we can query it.
Unsure what a graph is exactly? Check out my Data Science Moments video which introduces graphs and their uses in 5 minutes:
Getting Started
First, assuming we’ve already got NetworkX installed, we import it in to our code:
import networkx as nxWe will also be using pandas to read in our data so that will need importing too:
import pandas as pdThen we read in our data. The data in this example is book co-purchasing data with can be downloaded from my Github at ToriTompkins/Datasets (github.com)
If a book in the dataset has been purchased with another book that relationship will be stored in the file ‘relationships.csv’ so first we will need to read that in and display it:
relationships = pd.read_csv("relationships.csv")
display(relationships)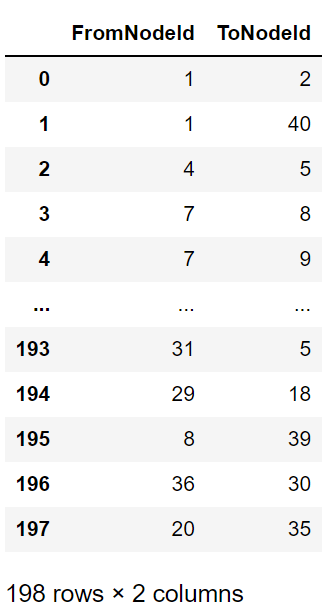
If we look at the data in relationships we can see it has two columns ToNodeId and FromNodeId. This is called an edgelist, basically a dataset which is a list of edges, where they start and end. To turn this into a graph, NetworkX has a really handy function from_pandas_edgelist:
graph = nx.from_pandas_edgelist(relationships, source="FromNodeId", target="ToNodeId")Now we already we have our graph, if you want to see what this looks like you can run:
nx.draw(graph)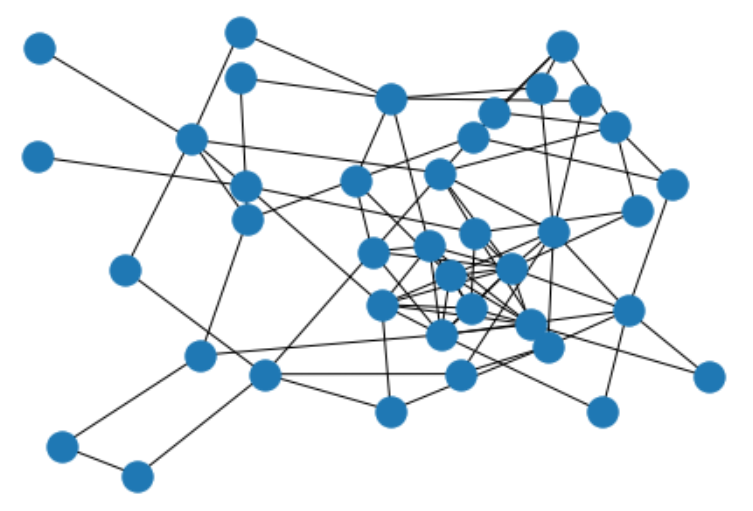
To get some basic facts about our graph:
nx.info(graph)The info function tells has the type of graph (unweighted and undirected), the number of nodes (39), the number of edges (94) and the average degree (4.8205) which means the average amount of edges a single node has in the graph.
Query Graph
While this is pretty cool it doesn’t give us much context about our data. So we can add some attributes from ‘books.csv’:
books = pd.read_csv("books.csv")
display(books)
This dataset can tell us a bit more about the nodes/ books in our graph so lets apply them to the graph. To do this we need to use the NetworkX function set_node_attributes but it needs the data in a dict format first:
attributes = books.set_index("Book ID").to_dict("index")
nx.set_node_attributes(graph, attributes)
Now we can query our graph! Let’s say we want a list of all books written after 1990:
[node for node, attribute in graph.nodes(data=True) if attribute['Year Written'] > 1990] [7, 8, 9, 10, 11, 12, 30, 36, 20, 24]The code above returns the node ids if you want to return the book title, we can leverage the attributes:
[attribute['Book Title'] for node, attribute in graph.nodes(data=True) if attribute['Year Written'] > 1990] ['Harry Potter and the Chamber of Secrets',
'Harry Potter and the Deathly Hallows',
'Harry Potter and the Goblet of Fire',
'Harry Potter and the Half-Blood Prince',
'Harry Potter and the Order of the Phoenix',
'Harry Potter and the Prisoner of Azkaban',
'Vardi Wala Gunda',
"Harry Potter and the Philosopher's Stone",
'The Bridges of Madison County',
'The Da Vinci Code']If you want to return all books co-purchased with a book with node ID 1, you can use the neighbors function:
[node for node in graph.neighbors(1)]Finally, we want to do something a little more complicated. We want to find ‘Lord of the Rings’ in our graph and then find all the books co-purchased with it. We can do that by combining what we have learnt so far:
book = [node for node, attribute in graph.nodes(data=True) if attribute['Book Title'] == "The Lord of the Rings"][0]
[graph.nodes[node]["Book Title"] for node in graph.neighbors(book)]
['The Odyssey',
'Ben-Hur: A Tale of the Christ',
'Harry Potter and the Prisoner of Azkaban',
'The Hobbit',
'The Adventures of Sherlock Holmes',
'The Lord of the Rings',
'And Then There Were None']As you can see, its really easy to get a usable, enriched graph quick with NetworkX. The real power of NetworkX and graph analysis in general is leveraging graph algorithms to learn things that you couldn’t with tabular data. Check out my Graph Series of Data Science Moments to learn more: